If you’re not doing it, who is?

Obviously, something appears to be running outside of Windows. Unfortunately, I am unable to find and DESTROY it.
One thing I can tell you is it’s not “outside” of Windows. The assumption that CPU usage is telling you something is incorrect.
We’ll use Process Monitor to see exactly who’s doing what on your machine.
Become a Patron of Ask Leo! and go ad-free!

Constant disk activity in Windows
- Install SysInternals tools.
- Run Process Monitor.
- Collect data when disk activity is happening.
- Use the “File Summary…” tool to see which file(s) are being accessed most and by what process(es).
Process Monitor
Process monitor is one of the “SysInternals” tools. You can install the tools via the Microsoft Store. You’ll get several tools useful for a variety of situations.
Process Monitor, or “procmon”, is a different tool from Process Explorer, or “procexp”. I’ve termed Process Explorer “Task Manager on steroids” and refer to it often.
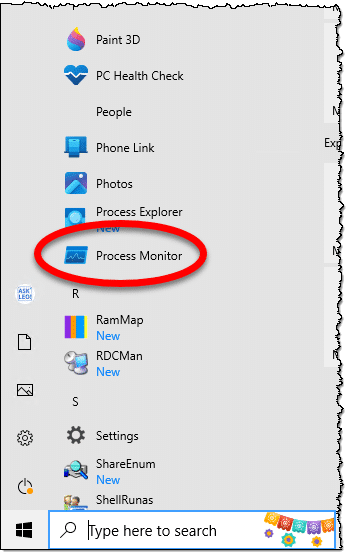
Not today. Process Monitor is what we’ll use. After installing SysInternals Tools, you’ll find it on the Start menu.
CPU usage
Let’s start by clarifying the CPU usage issue.
It’s quite possible for your CPU to be doing “nothing” while your disk thrashes. The CPU is much faster than the disk, which means it’s spending most of its time waiting for the disk to read or write data. For a CPU, “waiting” means “doing nothing,” which is often called “idle”. Even if the disk is thrashing as you describe, 98% idle makes total sense. CPU usage of 2% or even much less is plenty to keep the disk busy.
When it comes to disk activity, you can ignore CPU usage. It’s not telling you anything valuable.
Process Monitor
When you run Process Monitor, it’ll start collecting data immediately.
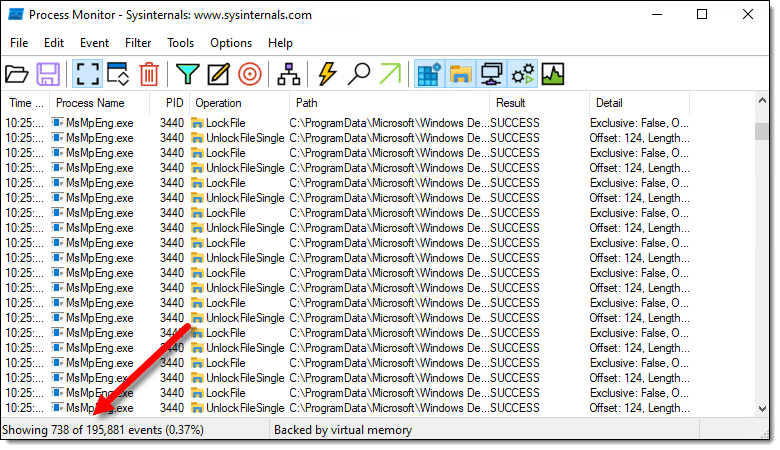
The numbers in the lower left-hand corner will increase as Process Monitor collects data.
Press CTRL+E to stop the data collection for now.
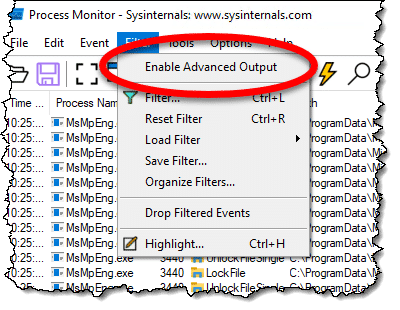
Make sure that Enable Advanced Output is not checked on the Filter menu.
Unlike Process Explorer, which shows you process information in close-to-real time, Process Monitor works by collecting data for a period of time and then gives you various tools to review and analyze the data collected.
Running Process Monitor
Because Process Monitor begins collecting data once you run it, that’s all you need to do to begin the process.
If your concern is a start-up problem, use Process Monitor at Windows Startup time by adding it to the Startup sub-menu. If you can make the situation you’re investigating happen, run Process Monitor first. If the problem happens randomly, run Process Monitor when you notice the issue.
After Process Monitor has run “a while,” collecting data during the behavior you’re concerned about, click on it and press CTRL+E to stop data collection.
Analyzing Process Monitor results
Rather than trying to analyze the raw data (which you’re more than welcome to do if you like), Process Monitor includes several handy summarization tools on the Tools menu.
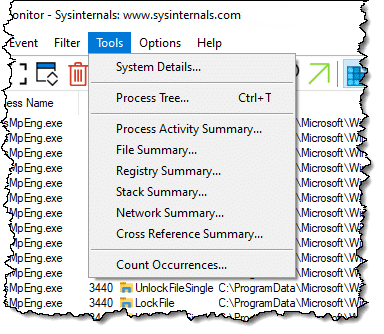
Click File Summary… for a report of the file I/O activity (input/output activity: the movement of data between the processor and disk) within the recorded data.
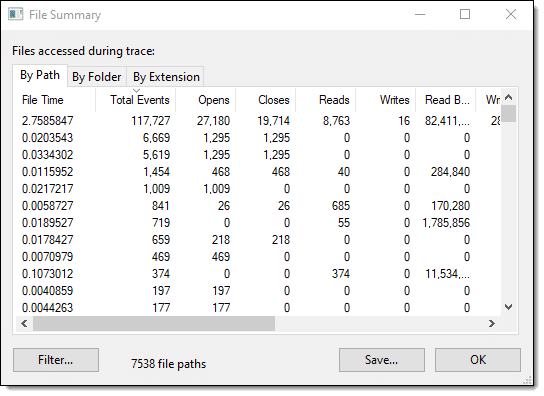
The default is sorted by “Total Events.” Scroll the data to the left to see the rightmost Path column. If the filename is longer than the column width, hover over it to display the full path as a tooltip, or widen the column by dragging the right-hand column divider, also shown below, further to the right.
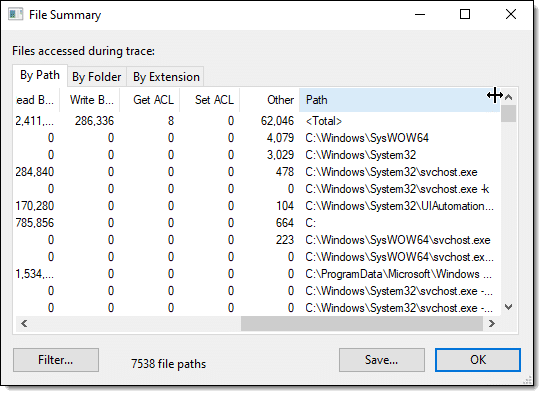
In this case, you can see that “C:\WINDOWS\SysWOW64” was the most-accessed file during this capture.
You can also sort by any of the other column headers in the file summary dialog so as to see which file took the most time, had the most reads or writes, or did any of several other activities. I would assume that for a simple “Why is my disk thrashing?” analysis, the default “Total Events” is the best place to start.
Once you’ve identified a file you want to understand more about, double-click it, and the main Process Monitor window will automatically filter the data to include only accesses of that file. For example, I’ve double-clicked on that “SysWOW64” file here.
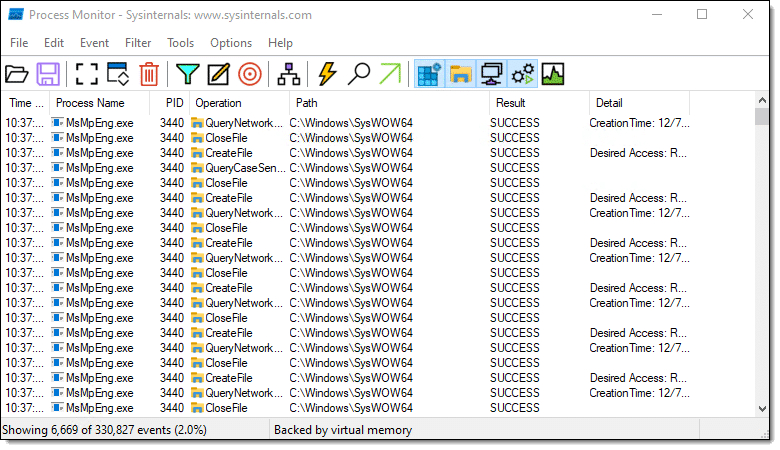
Now, we can see that at least initially, the process in question was “MsMpEng.exe”.
Double-click any line there to get more detailed information about that specific event and the process that caused it.
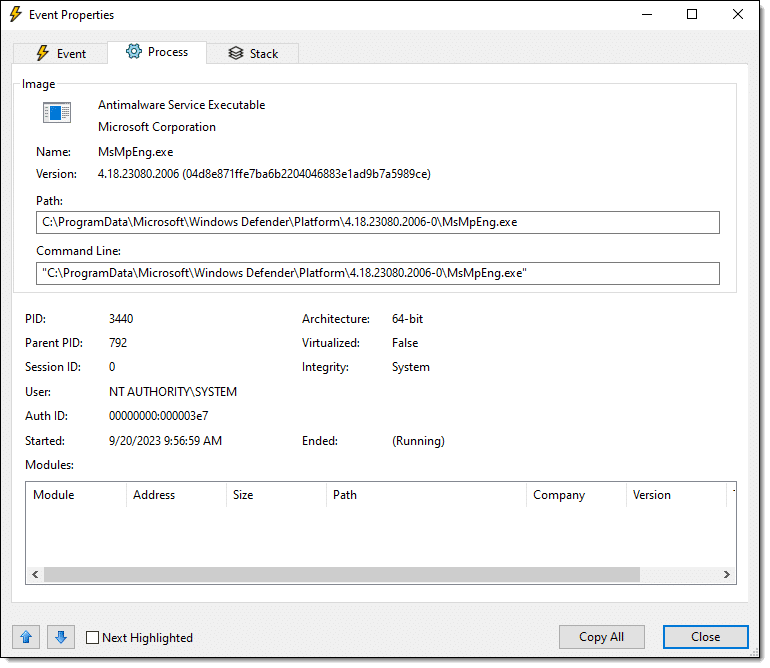
I’ve clicked on the “Process” tab, which is likely to be the most useful for this investigation. Here, it identifies MsMpEng.exe as the Antimalware Service Executable. I had instructed Windows Security to perform a full scan of my machine, so my disk activity was the result of that scan.
Do this
What happens next depends on what you’ve found.
Process Monitor (and Process Explorer) won’t fix anything. They’re both tools to help you answer the question, “What’s happening?”
Process Monitor is very powerful and somewhat complex. But the basic “capture and filter” scenario I’ve outlined above will get you 90% of the information most people are interested in.
If you’re at all interested in diving deeper, make sure to check out the Help information that comes with Process Monitor and spend a little time exploring its features.
Something else to explore? Subscribe to Confident Computing! Less frustration and more confidence, solutions, answers, and tips in your inbox every week.
Podcast audio

Related Video


Periodically I see something pop up near the top left corner of the screen. It is visible for only about a second – too quick to see what it is.
Would Process monitor tell me what that is. I’m concerned that it might be some malware or something else rogue that could be collecting data.
I do have Malwarebytes and Microsoft Defender running so am confused what that might be.