Yep, that sounds slow.
It happens to me from time to time as well. A program decides it has something very, very important to do and uses all the computer’s processing power to do it.
The good news is, it’s pretty easy to find out which program that might be.
Become a Patron of Ask Leo! and go ad-free!

Computer CPU cores can only do one thing at a time. It seems like more because they’re switching between tasks faster than we can see. When a task performs intense calculations, or just has a bug, it can “hog” or use all your CPU, preventing other tasks from running smoothly or at all. Windows Task Manager can show you who’s using all the CPU.
Multitasking is a lie
All evidence to the contrary, computers can only do one thing at a time.
More precisely, each computer’s core can only do one thing at a time. A dual-core machine can do exactly and only two things at a time, a quad-core can do four, and so on.
Be it one core or dozens, to you and me it looks like one computer doing several things at once — many more things than it has cores.
The magic is that the computer is constantly switching back and forth between all those things so quickly that it looks like they’re all happening at once. They’re not.
CPU hogs
When one program needs all of the CPU’s attention, other programs that also need the CPU might not get enough time to do their work. Exactly how that manifests on modern multi-core machines depends on how the software was written.
If the software was written assuming a single CPU — so-called “single-threaded” software — you’ll see one core of a multi-core processor fully used1 while the other cores remain available for other things. You might see a solid 25% CPU usage on a quad-core computer, for example.
On the other hand, if the software was written to utilize all available CPUs — “multi-threaded” software — it’s not uncommon for a CPU hog to fully utilize all the available CPUs.
Sometimes, it’s the right thing to do; what you’ve asked the program to do requires all available computing power.
Sometimes, it’s a bug or a sign of some other problem.
Task Manager
In Windows 102, Task Manager helps us determine what program is hogging the CPU.
Right-click on the clock and click on Task Manager. The initial view may be exceptionally unhelpful.
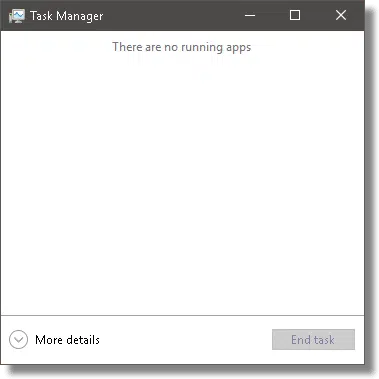
By default, Task Manager only displays those programs you’ve explicitly run.3 We want to know about everything, including the software making up Windows itself.
Click on More details near the bottom of the window.
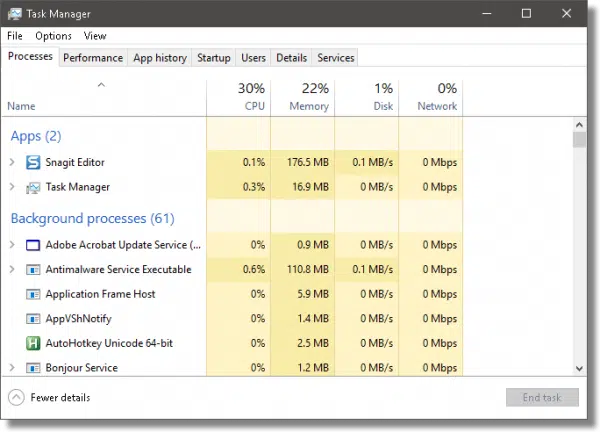
Not only will you see many more programs listed, you’ll see the system resources each is using.
Click on the “CPU” column header. This will sort the list of running software in order of decreasing processor usage.
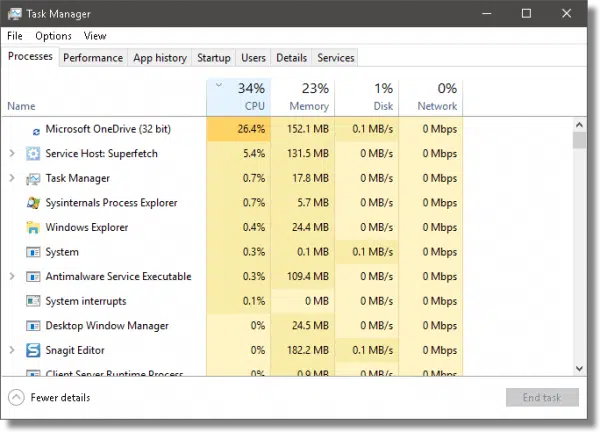
In this example, it’s OneDrive — or rather, the OneDrive service — that’s the biggest current user of CPU: 26.4%. If this were a quad-core machine, I might suspect OneDrive was completely using a single CPU. Since this is a two-core machine, it’s just OneDrive doing its thing, which is not uncommon, particularly after rebooting.
Svchost can be special
One of the common culprits in unexplained CPU usage is something called “Service Host”, or SVCHOST. You can see it as the #2 item in the list above.
Click on the “Name” column heading to sort the list by category and name once again, and then scroll down to Windows Processes. You’ll see many instances of Service Host running.
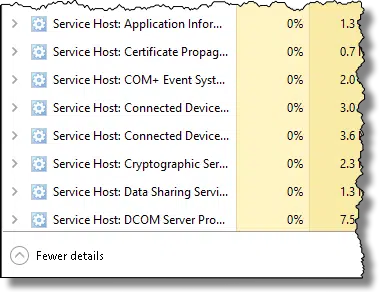
Service Host does many things, as you can see, but one of the more common culprits over the years has been the Windows Update service. For a variety of reasons, it used to commonly get confused and show up as hogging a CPU. There are several approaches to fixing Windows Update.
Be it Service Host, OneDrive, or something else, Windows Task Manager is a quick way identify CPU-hogging culprits.
Do this
Subscribe to Confident Computing! Less frustration and more confidence, solutions, answers, and tips in your inbox every week.
I'll see you there!
Podcast audio

Related Video


Footnotes & References
1: In reality, it’s rare that a single core will be maxed out, but the work will be spread out among all cores as Windows shifts the program around. The net effect is that each core will show a percentage of use equivalent to a single core being 100% utilized — for example, 25% usage on a four-core machine.
2: For previous versions of Windows, I tend to prefer the free download Process Explorer, also from Microsoft.
3: Actually, the definition is a little weirder than that, from what I can tell.

Speaking of multiple svchost processes…
Is it possible to know which svchost process is handling which services? (This is XP Home, which doesn’t have a “tasklist” command.)
—–BEGIN PGP SIGNED MESSAGE—–
Hash: SHA1
Sure. Download and use Process Explorer as described in the article.
Leo
—–BEGIN PGP SIGNATURE—–
Version: GnuPG v1.4.6 (MingW32)
iD8DBQFGL7aZCMEe9B/8oqERAu3VAJ93IWx94phJ0Ijb/vvtvUmDjqGo+QCcDE6W
bh3f5VCvMCOgO1ThrmCVmak=
=dXFA
—–END PGP SIGNATURE—–
Leo, I’ve been around the block a time or two and can make absolutely NO sense of this program. Once I click on “CPU” the list keeps jumping around like banshees. I tried to right click on one program but couldn’t catch it!!
Quite frankly (and I’m no beginner) I can’t figure out what it’s supposed to do or how I’m supposed to run it. Any suggestions before it finds the bottom of my recycle bin?
Sometimes when a process begins hogging CPU, it locks the computer and nothing can be done to trace it. There is one solution to this, a free program called Process Tamer http://www.donationcoder.com/Software/Mouser/proctamer/index.html
It limits CPU usage for individual programs effectively preventing your PC from seizing.
While you’re checking it out, check out the rest of Donation Coder, they are a very good group of programmers.
Processing power… Unless I missed something,you’ve explained how this effects a slowing of PC operation… but how does one cure it….Telling me, by a garage mechanic why my car does what it does is not much help unless someone tells me how to fix it….Most of us are not too interested in “why”… just how can it be remedied?
Re: Posted by: Dell at April 27, 2007 08:46 PM
If you simply left-click on any column heading, OTHER than CPU, the the list will stop jumping around like banshees.
Regards
Bill
—–BEGIN PGP SIGNED MESSAGE—–
Hash: SHA1
It jumps around because which programs are using the CPU changes. Every second
process explorer updates the list to be in the current most-used CPU usage
order. You can adjust the update speed if you like using the View->Update Speed
menu item. Or you can click on the CPU column again to get things sorted by
name.
Leo
—–BEGIN PGP SIGNATURE—–
Version: GnuPG v1.4.6 (MingW32)
iD8DBQFGNCUCCMEe9B/8oqERAmdlAJ9Byx+Sdt8ZRQKedWBwfxViJgIhEgCdHl9s
goxdy1YmSopHu7B+Rtg85/Y=
=ttgT
—–END PGP SIGNATURE—–
—–BEGIN PGP SIGNED MESSAGE—–
Hash: SHA1
Joseph: a garage mechanic can’t fix a car without seeing it. There are SO many
reasons that a program might suck up all the CPU there is no one, single
solution. All that mechanic-at-a-distance can do is provide you with some tools
to help diagnose the problem yourself.
What this article does is provide a way for you to gather perhaps the most
important clue: to figure out what program is taking all the CPU. That could be
any of 100’s programs, and the next steps to fixing the problem will depend on
what program that is.
Leo
—–BEGIN PGP SIGNATURE—–
Version: GnuPG v1.4.6 (MingW32)
iD8DBQFGNCfrCMEe9B/8oqERAkrlAJ498imjoCKcURmnSbF5JLISjPJa8wCfRT6N
Y7rLEfFoojMWZwdmfqPaf40=
=1bOG
—–END PGP SIGNATURE—–
Very useful and easy to understand. I’ve printed this article for myself because I need the hard copy of multiple-step instructions right in front of me as I’m doing whatever. But as with so many Web pages, the meat of the article printed in such tiny print that I’m having a devil of a time reading it. My 8 1/2 x 11 page is full, I didn’t have to shrink it to fit, and under my View category, I’ve clicked on the Largest type size, but none of this helps the pages to print the type in a larger size. This is only for Web pages and email. Word and Excel documents print whatever size I tell them to print. Suggestions, please. My printer is an hp 7660 and I know how to change things in the printer only through the pages I can reach when I click on the Print button. Thanks for any help you can give me.
—–BEGIN PGP SIGNED MESSAGE—–
Hash: SHA1
What browser are you using?
Leo
—–BEGIN PGP SIGNATURE—–
Version: GnuPG v1.4.6 (MingW32)
iD8DBQFGNkOtCMEe9B/8oqERAj1cAJ9IP4qRHbXO011Jk2PZnFAoCBx05wCeP+Bf
TsqR8u0I4gJTQzlR5jTgkzc=
=v18+
—–END PGP SIGNATURE—–
I agree with Leo, Process Explorer is invaluable. So much so that I have it set to run automatically at startup time (minimized to the system tray).
I use PE with the display sorted by process name. This keeps things from jumping around like they do when sorted by cpu usage. It also gets rid of the process tree display which is of no use to me. The only down side to this is that if you have many processes, the one using the most cpu may not fit in the display and you’ll have to scroll down to see it.
And, I get rid of the lower half of the display which is also of no use to me. There is button on the toolbar for this – it is referred to as the lower panel.
Click on View -> Select columns. PE is a wealth of information.
What about the dire warning you get when you elect to kill a process? Overkill? I have experienced a serious crash after killing a running process.
22-Apr-2010
Time after time over the past 10 years of using WinXP (now SP3) I’ve found that it’s always the “DNS Client” service that’s taking up all my (single) CPU’s cycles after a Windows Update. Simply disabling that service whenever I see _svchost_ going berserk immediately brings my computer back to its normal operating state, and there are absolutely no negative consequences in terms of web-surfing. Try it and see if it works for you.
Few things any of us do really uses much of the CPU (burning DVDs, movie editing, etc are some examples that do)… most of the time when you have a performance problem it is from another source than pure CPU usage. Four primary culprits are: disk access contention; memory saturation; network saturation; lock contention. My home systems are almost always at 100% CPU usage with no problems as we use background processes doing real science
Using either Task Manager or Process Explorer, with nothing open except one IE page (yours), System Idle Process ranges for the CPU column as 75-95. Your comments indicate this is a percentage. Under the Performance tab, the graphics for CPU Usage and CPU Usage History are ranging 0-40-50%. And, at the bottom of Task Manager the number of prcesses open is indicated along with Commit Charge and CPU Usage in a range of 5-18%. What are the difference between the two CPU usage percentages then? I still have not been able to figure out why some execute files such as iexplore.exe, explore.exe, taskmgr.exe also keep bouncing around with different CPU and Mem Usage numbers. Thank you.
AnVir Task Manager Free is no only a close competitor to Process Explorer, it puts an icon in the information area that, when clicked, brings up a little always-on-top window that tell you what your CPU usage is (for every core), how many processes are active and which one or two processes are using the most.
This is very useful for watching activity without getting in the way.
You are a wealth of information Leo! I wonder how accessible Process Explorer is with screen readers? Or perhaps I’ll just have to figure that one out myself? I’ve been having issues with my Windows Vista machine for quite some time, and I’m wondering if I need to check up on all the processes going on in there or have someone help me do it. I actually gave Microsoft’s new dedicated accessibility hotline a call several months ago to see if they could help me figure this out. I talked with Ryan who was very helpful. One of the things he did was try and perform some sort of scan at boot-up, but it refused to work after a few attempts. So I think one thing I need to do is just try and figure all this stuff out. I’ve asked others about these more technical things, but the response has always been that I should probably not mess around with anything because it’s too technical and I could inadvertently disable something that I really do need, such as the sound drivers. I think it’s rather ironic that I’ve always been told to leave this more advanced stuff alone, yet I want to learn more technical skills.
The svchost service processor-hogging problem (which I have experienced, grinding the PC almost to a complete halt) was mentioned. It might be worth noting that a Microsoft Fixit for this (if I’m reading everything correctly) managed to screw up the “Background Intelligence Transfer Service”, which is used for updates, due to an error when used on XP (yes, I KNOW support is ending soon!). Reference here:
http://forums.techguy.org/windows-xp/1114342-svchost-again-3.html
I had all the problems mentioned and have used the script in the post created by Dougcuk and it works a treat, safely doing exactly what it says on the tin, restoring the BITS service and therefore the update service and no more svchost bringing the computer to its knees either. If anyone has the weird service “@%SystemRoot%\\system32\\qmgr.dll” or similar showing in XP, this appears to be part of the problem and the script should affect a cure.
Thanks!
Something was eating up my CPU 80% yet the task manager was not able to show it. This one did, it showed svchost.exe eating up everything. I wonder how because this program is not resources intensive.
Typically when it’s svchost it’s one of the services that it’s providing. Most commonly a bug in Windows Update has been known to make this happen in the past.
I recently started to use Malwarebytes Anti-malware program. I run a scan daily. Since then, I have found my data usage has increased alarmingly; is this new program using up all my data?
Hi Bette, did you ever receive an answer to your question about whether or not malware bytes uses up your data when running it daily? I did not see a reply out here to your question. I am not sure if anyone is answering questions out here? 🙂 I recently downloaded malware bytes too and wondered the same thing.
thanks,
Malwarebytes doesn’t access the internet other than to do periodic upgrades and malware definition updates. Those are relatively small and are comparable to other antimalware programs in data usage. Considering the alternative: not being protected, I’d opt for the small increase in internet data use.
Wow, Process Explorer helped quite a lot. I installed it and found out one particular application was using about 22% CPU. So i killed the process and uninstalled that application. An voila my CPU stopped “overworking”. Thanks so much
What causes high cpu usage?
That would be some program running that is either a big program, or perhaps has a bug of some sort. Basically it is a program that is using a lot of your resources.
To Dell,
You can adjust the number of seconds on the refresh under VIEW; Update Speed, and then pick a slower number of seconds so you can get a snapshot of the screen before it changes again.
Great program, Leo! I just searched and found your answer to the exact same question I had and this program is indeed what I was looking for.
Thank you!
thanks leo! i read your blog and it helped,at first my fan was running so fast and it seemed that the system was trying to compensate the workload by the graphics controller and ending tha task returned it to normal mode.
Ok so svchost is using 47% of cpu so if it windows update that’s the problem how do I fix it?
Could be many different things (svchost does many different things). Most common is Windows Update. Try: https://askleo.com/fix-windows-update/
G’Day Leo
Excellent info, my poor little Allienware sys was running its fans at full pelt almost all the time. I was expecting the bearings to fall out soon. Since stopping that wretched windows update service and now system is running nice and quiet, great to have her back. I like ProcessExploerer too.
Thank you.
Leo, you are a magic man! Finally, you solved my big problem with 100% CPU usage. I have been at this problem for days and no website explained this as carefully and as well as you did. I feel like I just got cured from some disease!
Sure enough it is my Windows 7 windows update. My computer went from 100% to 10% as soon as I stopped it.
Now I have to figure out how to solve MS intrusion further. I had been having a heck of a time with updates, backups and defragging. Now it all adds up and MS is the villain and not my computer.
This is what we get when we didn’t want Windows 10. I did run across many IT people with that very opinion and boy do I agree now!
Dear Mr. Notenboom,
I built my own gaming system. It has an intel i7-4790 @4GHz, 16GigRam@2666MHz, Win7x64Ultimate(6.1,Build7601)SP1, EVGA Z-97 chipset, EVGA GTX 970SSC@4GB ram, 500GB SSD, 256GB SSD, Realtek Audio, 1KW psu, and a couple 1GB WD Drives. (Hope this is relevant for you)
My problem is this: In the middle of almost anything (not every day, but often more than once a day), the hard drive light starts blinking rapidly, and nothing responds but the mouse cursor, as if cpu usage is at 100% or near. It stalls the games I and others are playing, and usually kicks us off Steam (game host pgm). I have tried to use Task Mgr to locate the high cpu usage in the processes tab, but the processor will not allow Task Mgr to open in time (stalled) to see what the process is. Sometimes it tapers down to like 13% and allows some research, but I can never be certain I have identified the problem as it occurs. That # was when Win update would not ever finish until reboot.
I can r click the listed high CPU usage pgm in task mgr Processes tab, and select “Go to Process” from the choices. (Processes tab lists in ascending or decending order whichever column heading you wish. I usually have CPU highlighted) It then switches to the Services tab in Task mgr, and has highlighted each instance of the group of pgms that, say, Svchost.exe is running.(the actual problem) And they all have the same PID listing number, like 1001, I think. I can further r click and choose ONE of the instances of the PID service and either start, stop, or go to process. The offending process is usually svchost.exe. I know this is necessary to run Windows, but when I shut down the high usage instance one, the cpu usage returns to 1% or zero. Ofc, there are many instances of svchost running, but they have differing PID #s I think.
How can I see what is actually, realtime, locking me up? I ran chkdsk on C: on reboot, and read Event Viewer, which had a line that said:
Correcting errors in the Volume Bitmap.
Windows has made corrections to the file system.
And also: Cleaning up 143 unused index entries from index $SII of file 0x9. Otherwise the rest of the entries didn’t show me much to alert to.
After this was done, my CPU widget on desktop shows 0% CPU usage after a few seconds. Task mgr shows no backgnd CPU usage anymore. I’ve had to run chkdsk every coupla days to keep System Idle Process at 99% when it was truly idle. WHY does this svchost snag 100% CPU usage, and seem to be running some scanner or something at 100%, but stops doing it in about 1 minute or so? Then I run svchost and it finds some errors. After that it is good for a while.
I use AVG, Advanced System Care 9, Malwarebytes Anti Malware, and Dr. Web CureIt. Recently, Win Update was inop and just hanged on searching for updates, and never finished, (until reboot or thru taskmgr and end pgm) but I had a complete cure with the info here:
http://www.howtogeek.com/247380/how-to-fix-windows-update-when-it-gets-stuck/
BTW, The scanner pgms I listed did find some problems, which I had removed earlier. Some of the info here may be a bit incirrect, because without the problem showing up, some of the Task Manager switches are not there, or do not act the same.
To relist questions:
1. Did I get fragged by a malicious pgm that left something broken, even after it was removed?
2. Is the ‘hard drive activity light’ being truthful, and my system is really using nearly 100% CPU on svchost.exe?
3. Could this svchost.exe be trying to do a chkdsk function before dying or something automatically?
4.Since svchost is a Win pgm that launches other dll’s, can it be a not so good pgm I have causing trouble at will?
5. Since scheduling a disk check on startup pretty much fixes it for a while, and I have found through your tutorial about Event Viewer wininit event 1001, is there some known problem I have?
6. Windows does sometimes force “Your computer needs to be checked for errors, recommended” as a startup choice, and then it starts normally. WHY is this OS so easily damaged or fail so easily?
7. What can I do to not be a problem for my computer to try to overcome? I already scan all downloads.
8. Is there a way to find out what HAPPENED as an event, that is the central issue?
Thank you for your thoughts, and I’m sorry this is so long. Your work is Most Excellent also!
Scott Abel–
{removed}@sbcglobal.net
Leo has an article about that problem, so instead of trying to explain what the problem might be, I’ll point you at that article:
https://askleo.com/how_do_i_fix_this_high_cpu_usage_svchost_virus_or_whatever_it_is/
Thank you for attempting to reply, Mark Jacobs. The link: https://askleo.com/how_do_i_fix_this_high_cpu_usage_svchost_virus_or_whatever_it_is/ seems to be almost 10 yrs old, and contains “this morning” references by Leo about his Win XP system. I have a much later version, in 64bit: (7×64 Ultimate). Thus, some of the suggestions are irrelevant. Specifically, when this near 100% CPU usage is occurring, I cannot run the procexp.exe pgm to see what is using 100% as there are no resources available to run it! And AFTER the fact, there is no record to look at.
Event viewer does not help, it seems, or report on things that happened like CPU usage %. WHEN this thing happens I cannot run anything else to observe what is happening, or identify the true source of the 100% usage and system lockup. If I wait till the CPU usage stops, then there is no event to view. Is Leo there? Or can you please send me to a link that is not 10yrs old, and about WinXP?
I’m here, and even though the article is 10 years old,and talks about Windows XP, the basics apply to Windows 10 today still. Run Procexp (or simply task Manager), and keep it running to see what’s using 100% CPU.
That may work, if it keeps running record of what WAS happening. Subsequent to your reply however, I have discovered in part what the problem was and am now free of it. As I said, I am a gamer, and use a pgm called Steam to chat with a friend while we play online together in a game called Call of Duty Modern Warfare 3. We 2 old guys play Survival against AI, and enjoy the banter. Recently when it kicked us both off of the game’s online feature, and the gameplay, I briefly saw something that said that Steam bootstrapper was having a problem. Since Steam is large (202Gigs including the games it hosts which are installed on the drive in it’s folder) I have been reluctant to uninstall/reinstall them all. But, though it took almost a day to do (since that all must be downloaded online from Steam at only 5mbps) it completely removed the problem! Steam/games was somehow infected or broken, and though I had done many self game cache integrity verifications on all the games without error, I assumed they were ok (according to the Steam self-check). There were many indications of other problems along the way, which were in part, caused by my zeal to get taskmgr to load NOW, so I could see what it was. (seems that frantic clicking on unseen desktop icons the black screen covered, the system remembered the clicked items and tried to open them after it returned to normal) Ofc, svchost.exe ran the pgm of Steam, and it’s hosting of the game.
Well, after reload and resetting all the options, the game plays right, as it should always have. The Steam error checking was not what it should have been. I find that your sensible error checking methods and knowledge have helped greatly, and I have shared the source with other friends–specifically the win update one. The Internet Safety .pdf was GREAT too! Thank you for your time, and sorry the symptoms were not really OS caused, but program flaws. They are irrelevant now that they are known, and it should be said that you were very helpful in finding what was NOT wrong with my system! You may remove this blather if you wish, since it is not really a problem with the OS, but rather faulty software about which you could not have known. The symptoms I experienced were simply inconclusive and frustrating. Again, Thanks!
Leo mentions this but some might have missed it. SVCHOST is the name of the process in older versions of Windows and Service Host is the same thing in Windows 10. Maybe Microsoft stopped abbreviating it to calm the fears of people who were afraid SVCHOST was malware. Malware can run under SVCHOST but SVCHOST itself isn’t malware.
http://ask-leo.com/what_is_svchost_and_why_is_there_more_than_one_copy_running.html
I experienced a strange issue on my laptop, where everything suddenly seemed sluggish while I was running certain programs. This happened a few times, so i checked with the task manager.
It seemed that my laptop was running at -exactly- 50% and lagging.
Further investigation discovered that one of my two CPU’s ‘goes to sleep’, even (or especially) under high processing loads, and I can’t do anything about it.
Wow, that’s really odd, and seems like a hardware problem if accurately described. I’d get it fixed, myself.